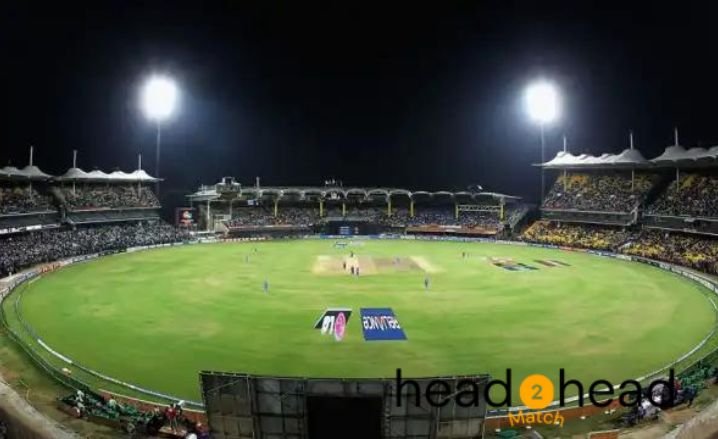
MA Chidambaram Stadium in Chennai, popularly known as the Chepauk Stadium, is known for its spin-friendly pitches. Some of the best Test matches have been played at this venue. Let’s take a look at the MA Chidambaram Stadium Test records and stats in detail.
MA Chidambaram Stadium Test Records & Stats
| Category | Details |
|---|---|
| City | Chennai |
| Country | India |
| Also or Previously Known As | Chepauk Stadium, Madras Cricket Club Ground |
| First Test Match | 10/02/1934 |
| Last Test Match | 13/02/2021 |
| Matches Played | 34 |
| Matches Won by Home Side | 15 (44.12%) |
| Matches Won by Touring Side | 7 (20.59%) |
| Matches Won by Neutral Side | 0 (0.00%) |
| Matches Won Batting First | 12 (35.29%) |
| Matches Won Batting Second | 10 (29.41%) |
| Matches Won Winning Toss | 13 (38.24%) |
| Matches Won Losing Toss | 9 (26.47%) |
| Matches Drawn | 11 (32.35%) |
| Matches Tied | 1 (2.94%) |
| Highest Individual Innings | 319 – V Sehwag (India) on 26/03/2008 vs South Africa |
| Best Bowling (Innings) | 8/55 – M H Mankad (India) on 06/02/1952 vs England |
| Best Bowling (Match) | 16/136 – N D Hirwani (India) on 11/01/1988 vs West Indies |
| Highest Team Innings | 759/7 dec (India) on 16/12/2016 vs England |
| Lowest Team Innings | 83 (India) on 14/01/1977 vs England |
| Highest Run Chase Achieved | 387/4 (India) on 11/12/2008 vs England |
| Average Opening Stand (Runs) | 41.12 |
| Average Runs per Wicket | 33.04 |
| Average Runs per Over | 3.00 |
| Average Score Batting First | 344 |
The MA Chidambaram Stadium, located in Chennai, India, is a historic cricket venue also known as Chepauk Stadium or the Madras Cricket Club Ground. It hosted its first Test match on 10 February 1934 and its most recent on 13 February 2021, having witnessed 34 Test matches in total.
In terms of match outcomes, the home side has won 15 matches, which constitutes 44.12% of the total games played. The touring sides have secured 7 victories (20.59%), while no matches have been won by neutral sides. When batting first, teams have won 12 matches (35.29%), whereas 10 matches (29.41%) have been won by the team batting second. The toss has proved influential, with teams winning 13 matches (38.24%) when they won the toss, and 9 matches (26.47%) when they lost the toss. Additionally, there have been 11 drawn matches (32.35%) and 1 tied match (2.94%).
The highest individual innings at the venue was scored by Virender Sehwag of India, who made 319 runs against South Africa on 26 March 2008. The best bowling performance in a single innings was by M H Mankad of India, with figures of 8/55 against England on 6 February 1952. For a complete match, N D Hirwani’s performance of 16/136 against the West Indies on 11 January 1988 stands as the best.
The highest team total at the ground is an imposing 759/7 declared by India against England on 16 December 2016. In contrast, the lowest team total recorded was 83 runs by India against England on 14 January 1977. The highest successful run chase at the venue was 387/4 by India against England on 11 December 2008.
Overall, the ground has an average opening stand of 41.12 runs, with teams scoring an average of 33.04 runs per wicket and 3.00 runs per over. When batting first, the average score is 344.
Also Read:

