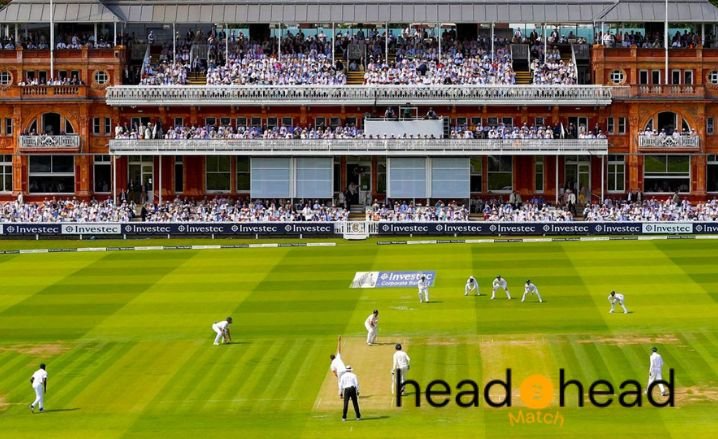
Lord’s Cricket Ground, situated in London, England, is often known as the Lord’s London. It is considered the most iconic cricket venue in history. Interestingly, the ground has a slope, which makes matches very interesting to watch. Lord’s hosts the final of the World Test Championship every two years. It has hosted a total of 145 Test matches so far. Here, we have covered all you need to know about the Test match records and stats of Lord’s Cricket Ground.
Lord’s Test Match Records & Stats
| Lord’s Test Match Statistics | |
|---|---|
| City | London |
| Country | England |
| Also or Previously Known As | Lord’s Cricket Ground |
| First Test Match | 21/07/1884 |
| Last Test Match | 28/06/2023 |
| Matches Played | 145 |
| Matches Won by Home Side | 57 (39.31%) |
| Matches Won by Touring Side | 35 (24.14%) |
| Matches Won by Neutral Side | 2 (1.38%) |
| Matches Won Batting First | 52 (35.86%) |
| Matches Won Batting Second | 42 (28.97%) |
| Matches Won Winning Toss | 52 (35.86%) |
| Matches Won Losing Toss | 42 (28.97%) |
| Matches Drawn | 51 (35.17%) |
| Matches Tied | 0 (0.00%) |
| Highest Individual Innings | 333 by Graham Gooch (England) on 26/07/1990 v India |
| Best Bowling (Innings) | 8/34 by Ian Botham (England) on 15/06/1978 v Pakistan |
| Best Bowling (Match) | 16/137 by Bob Massie (Australia) on 22/06/1972 v England |
| Highest Team Innings | 729/6 dec by Australia on 27/06/1930 v England |
| Lowest Team Innings | 38 by Ireland on 24/07/2019 v England |
| Highest Run Chase Achieved | 344/1 by West Indies on 28/06/1984 v England |
| Average Opening Stand (Runs) | 34.23 |
| Average Runs per Wicket | 31.16 |
| Average Runs per Over | 2.90 |
| Average Score Batting First | 311 |
Lord’s Cricket Ground, also known as Lord’s, is located in London, England. The first Test match at this ground was played on July 21, 1884, and the most recent one was on June 28, 2023. A total of 145 Test matches have been played here.
The home team, England, has won 57 matches (about 39%), while touring teams have won 35 matches (about 24%). Neutral teams have won 2 matches (about 1%). Teams that batted first won 52 matches (about 36%), and teams that batted second won 42 matches (about 29%). Teams that won the toss also won 52 matches (about 36%), while teams that lost the toss won 42 matches (about 29%). There have been 51 drawn matches (about 35%) and no tied matches.
The highest individual score at Lord’s is 333 by Graham Gooch of England against India on July 26, 1990. The best bowling performance in an innings is 8 wickets for 34 runs by Ian Botham of England against Pakistan on June 15, 1978. The best bowling performance in a match is 16 wickets for 137 runs by Bob Massie of Australia against England on June 22, 1972.
The highest team score is 729/6 declared by Australia against England on June 27, 1930, and the lowest team score is 38 by Ireland against England on July 24, 2019. The highest successful run chase is 344/1 by the West Indies against England on June 28, 1984.
On average, the opening partnership scores 34.23 runs. Teams score an average of 31.16 runs per wicket and 2.90 runs per over. The average score for teams batting first is 311 runs.
Also Read:

